Visual Effects World Atlas
VFX Company Growth (Headcount)
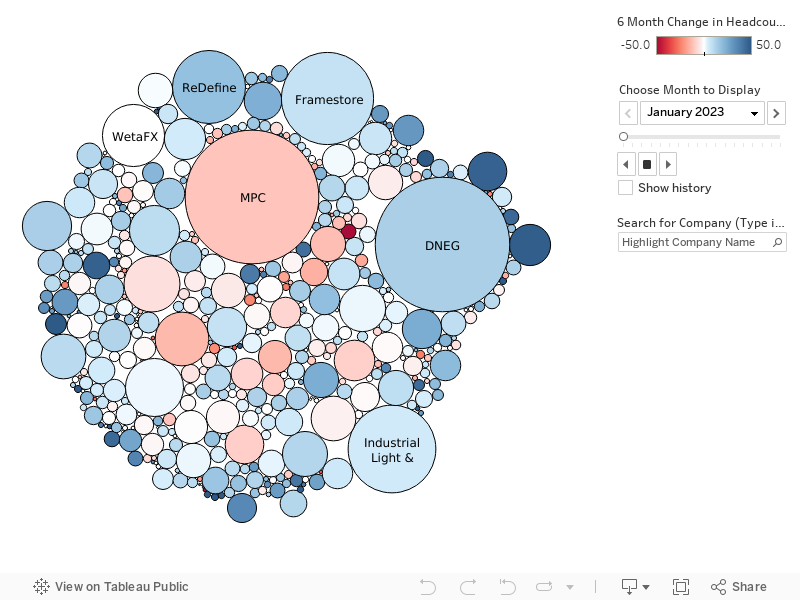
This chart shows approximate size and change in headcount for the companies in our study from January 2023 to June 2024. The colors represent whether a company's headcount has grown or shrunk over the previous six months.
Blue indicates growth, while red indicates a reduction in headcount. The darker the color, the greater the change. As we are looking at percentage change relative to the company's overall size, smaller companies tend towards darker colors.
You can select any month from January 2023 to June 2024 to view data for that month. You can also search for a specific company using the highlight search bar. We recommend clicking the full screen icon in the bottom right to see the chart with more detail (desktop computers only, not available on mobile).